Evgeni Hasin

Data, analytics & AI.

I’m Evgeni, a data and AI leader, and a builder at heart.

At AUTODOC and wefox, my work has spanned data strategy, scaling and enabling teams, and helping the business get more value from analytics (LinkedIn).

Here you'll find a collection of projects and activities, with a few personal experiments mixed in.

Open source · AI analytics

Reliable Analytics Agent

A generic AI chatbot can give a convincing answer even when the question is unclear or the analysis is wrong. My agent is built for trust:
It is governed by solid use-case and confidence gates, and controlled by multiple deterministic guardrails. It will clarify intent and ambiguity first, then ensure that every output is grounded. In case of doubt, it will refuse to answer rather than mislead.
Try a business question on the demo’s e-commerce data; the SQL is there to inspect.

Independent demo using the public Olist e-commerce dataset. Evaluation and known limitations are documented in the repository.

Python, DuckDB, Claude, Groq, Gemini, Streamlit
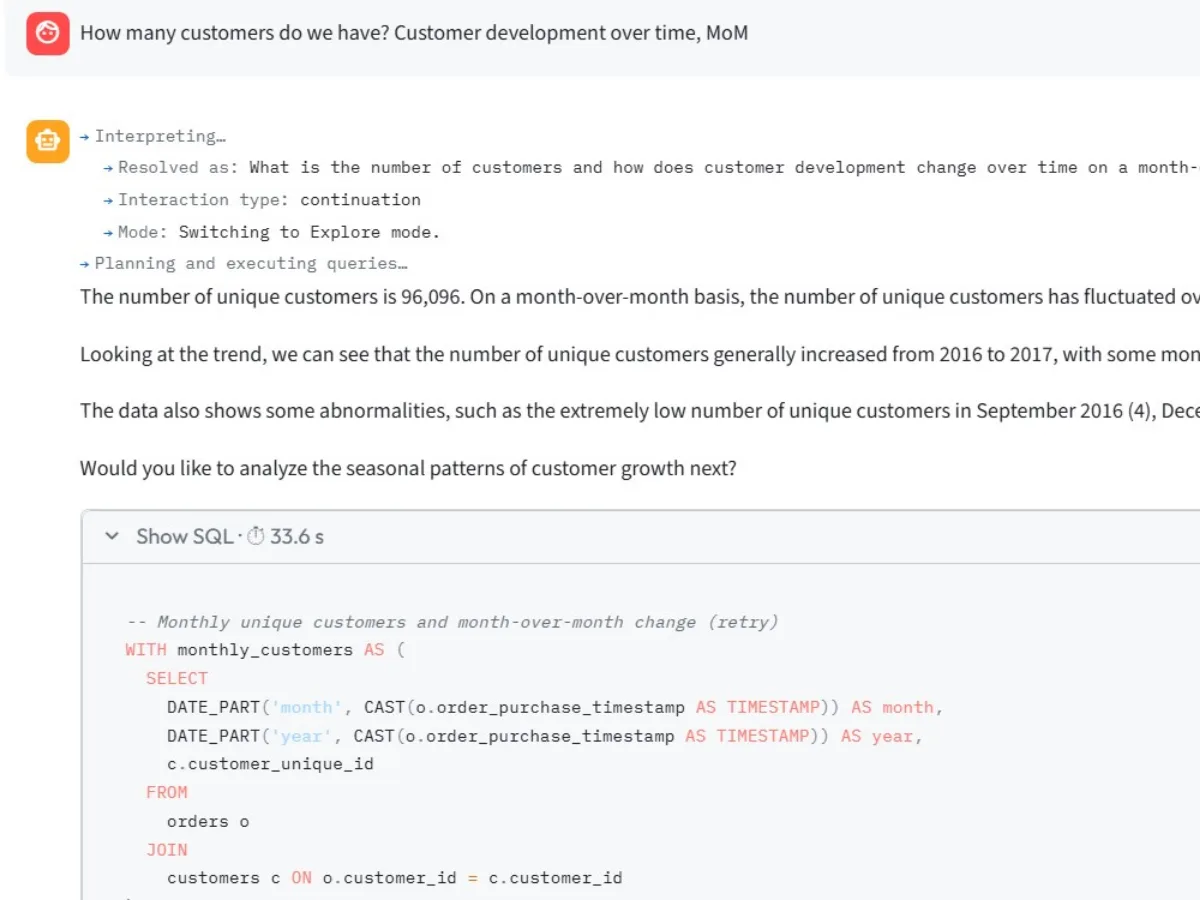
Analytics Agent showing an answer with supporting SQL
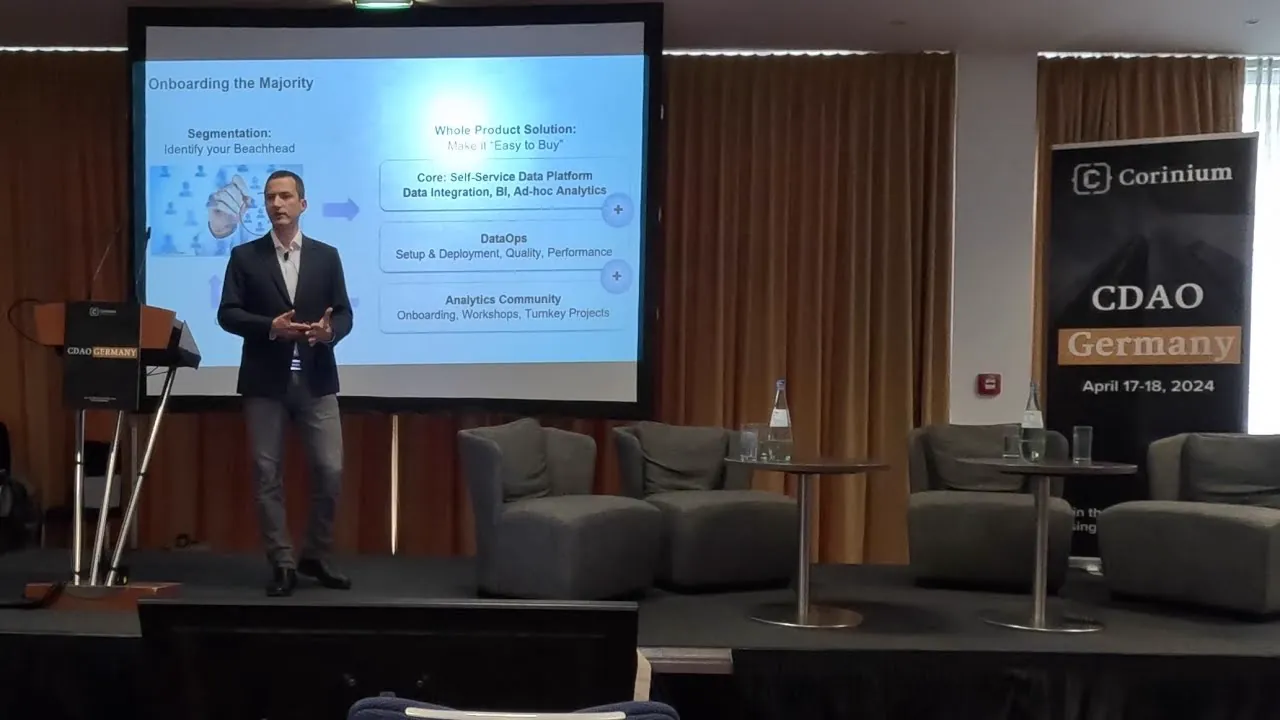
Conference talk · 35 min, including Q&A

Crossing the self-service analytics adoption chasm

What does it take to enable self-service analytics at scale? Delivering the tools doesn’t mean adoption will follow. This talk draws on our experience at wefox: onboarding business teams with a tailored “Whole Product” approach and DataOps support, and rethinking the role of data analytics in a data-literate organisation. The FP&A example starts at 17:38.

Recorded at CDAO Germany in April 2024, as Director, Group Data Analytics at wefox. Other speaking engagements include Big Data Minds, Berlin (2024), and Data Leaders, Utrecht (2025), on data democracy and capturing data value.

Evgeni Hasin on stage at CDAO Germany 2024, in front of the slide Onboarding the Majority CDAO Germany · 2024
Interactive explainer · neural network training

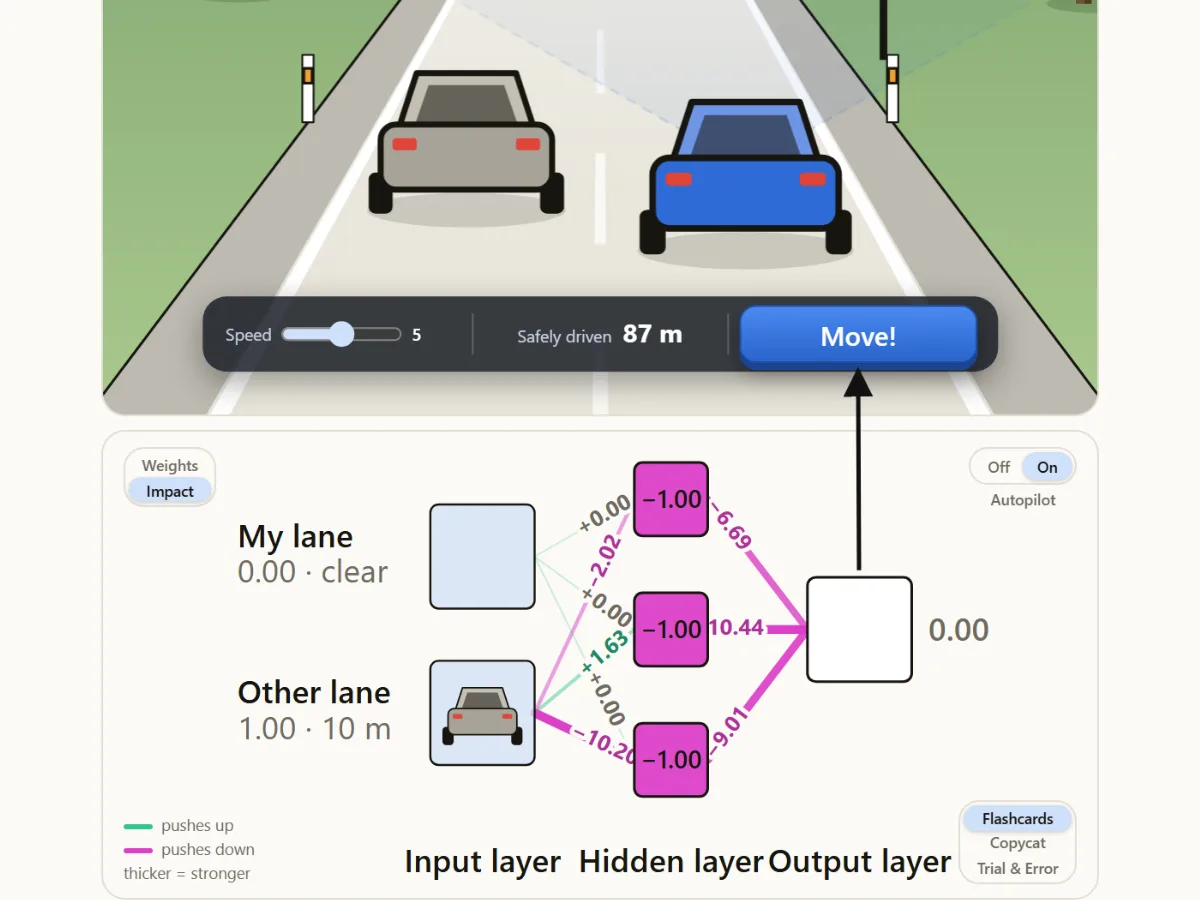
Self-driving neural network

Built for teaching my kids and anyone curious about how machines learn.
Explore various learning methods (flashcards, copycat, trial & error), observe how individual neurons impact a decision and how error correction propagates backwards. Finally, see how the trained network “self-drives”.

JavaScript, neural network implemented from scratch

Driving simulation with a visualisation of the neural network
Interactive explainer · Computer vision

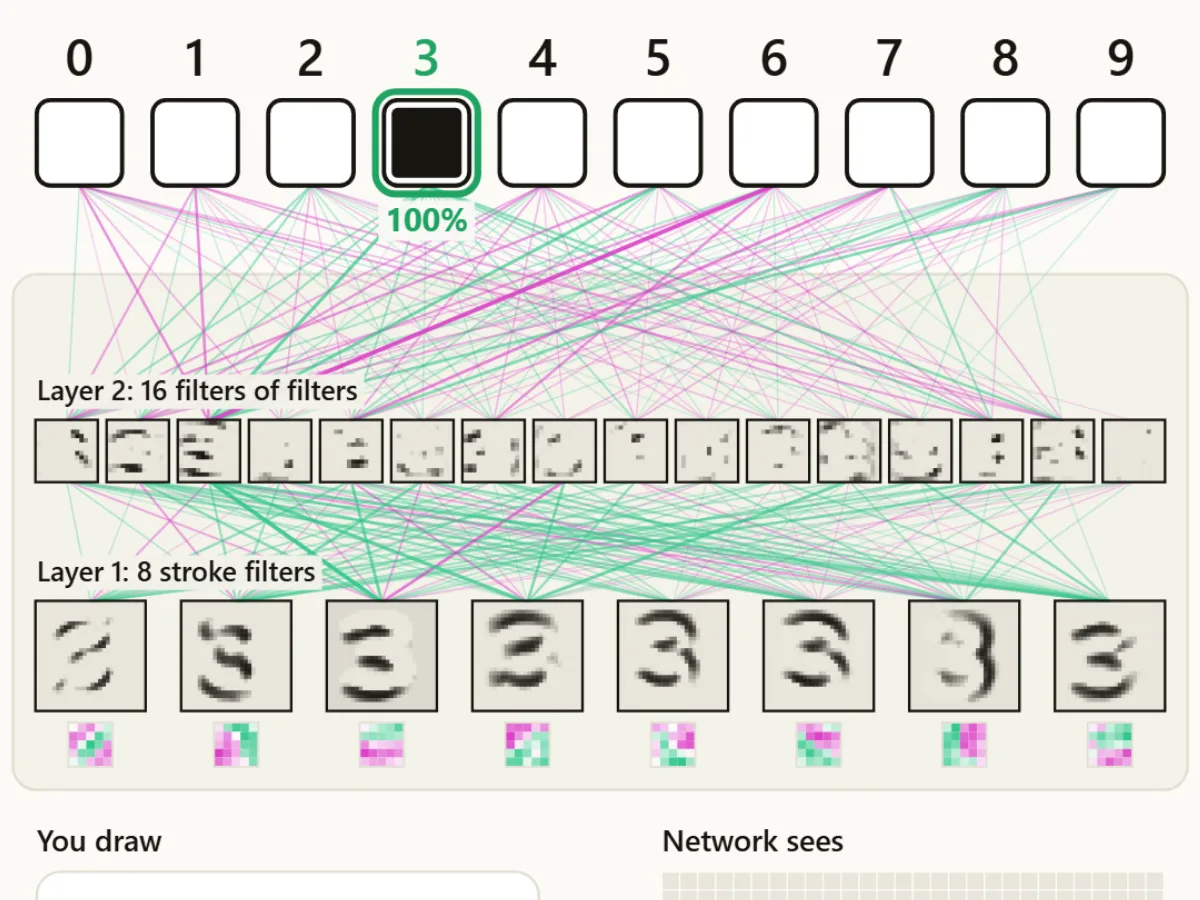
Digit recognition, layer by layer

Draw a 1, then add a few strokes to make a 4. Watch the network change its prediction as you draw. Now slowly add a curve to make it a 9. Its confidence shifts towards the new answer: an ML algorithm ‘thinking’ in real time. Fun to watch, and a great teaching aid!

Visualisation and inference code by Evgeni Hasin; pretrained MNIST model from the ONNX Model Zoo (MIT).

JavaScript, pretrained convolutional neural network

Handwritten digit passing through the convolutional network layers
Web app · Language learning

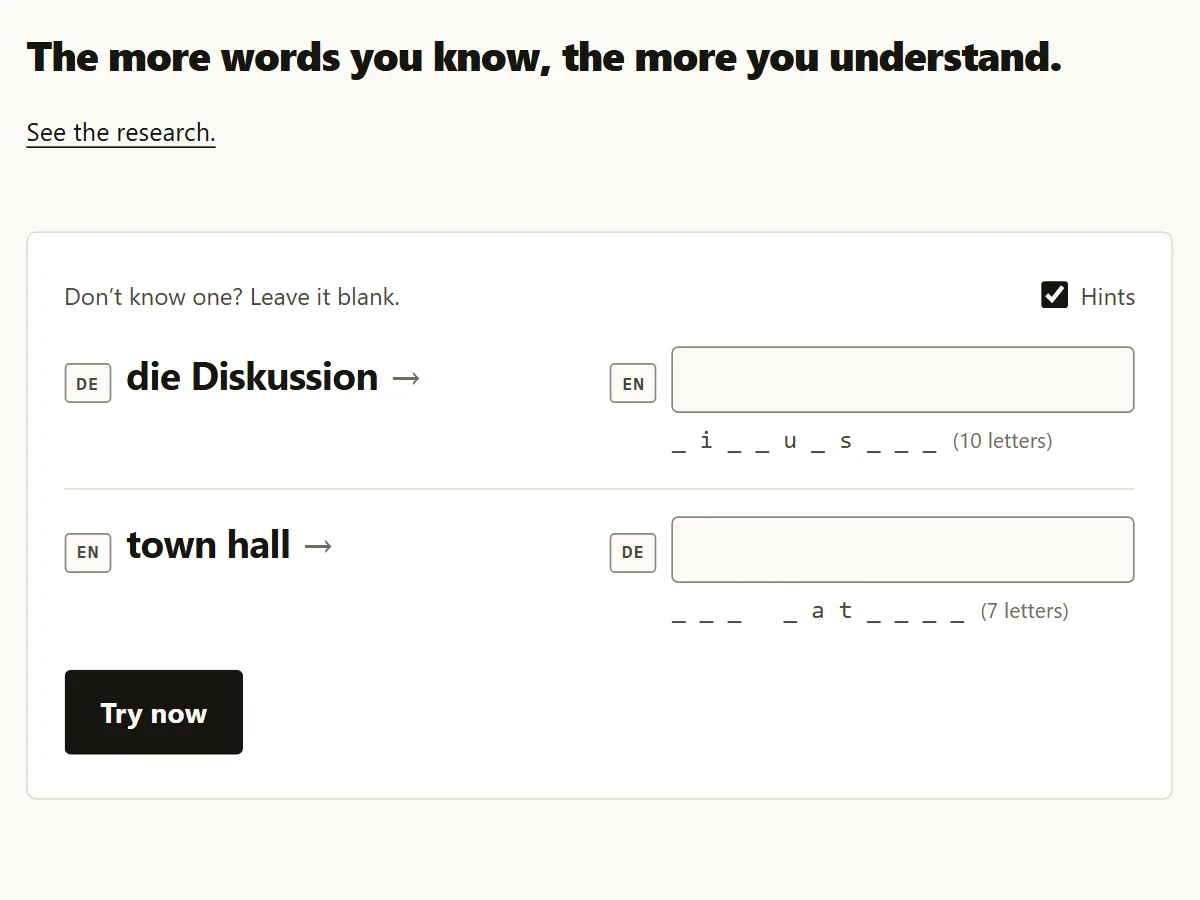
VCBLRY

German vocabulary practice with AI feedback on your answers. Choose a level and a goal, practise a few words, then come back to the ones you missed. A way to work on the gap between recognising a word and being able to use it.

Next.js, Supabase, generative AI

VCBLRY vocabulary practice interface
Game · Installable web app

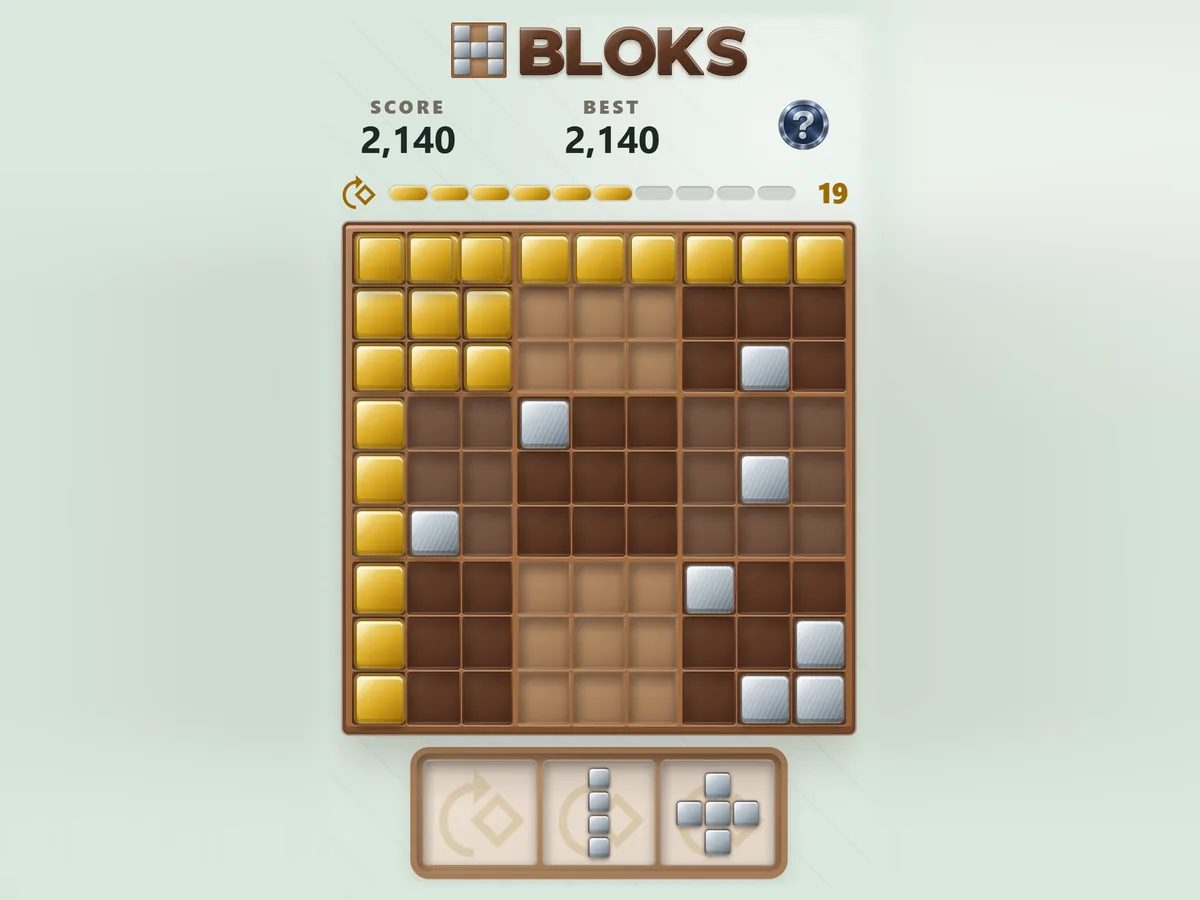
HBLOKS

A block puzzle born out of restless hands during podcasts. What started as something to play while listening now has a few dozen dedicated daily players. There are daily challenges, a leaderboard and progress that follows you across devices.

JavaScript, serverless API, Redis, product analytics

HBLOKS block puzzle board and available pieces
Archived project · COVID-19 analytics

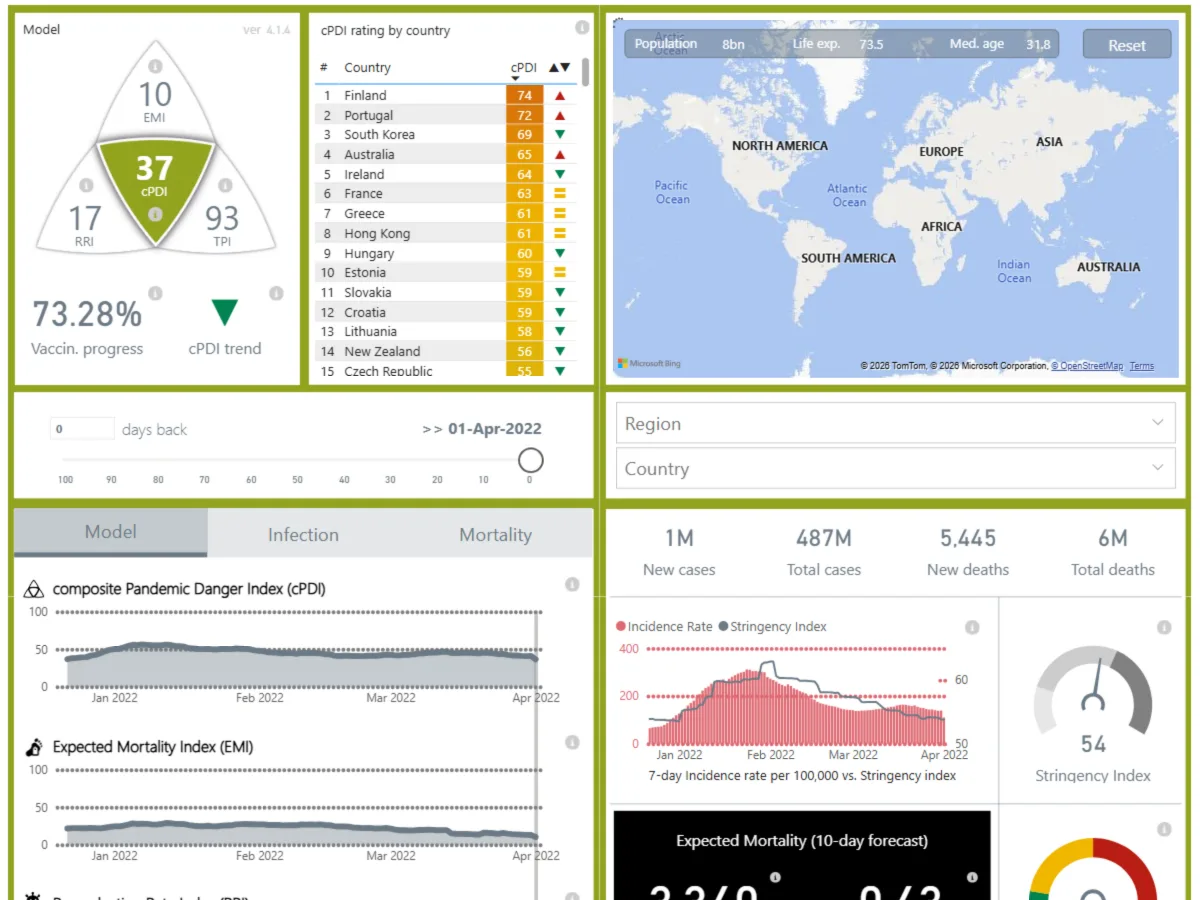
Pandemonitor.org

A volunteer COVID-19 dashboard that brought country comparisons, a risk index and a 10-day mortality projection into one place. The methodology is published alongside the charts. Kept here as an archive; the data is no longer updated.

Development and data integration: Evgeni Hasin. Mathematical modelling: Ronen Altman Kaydar. Design: Roie Shalom.

Power BI, data from Our World in Data

Pandemonitor dashboard showing COVID-19 indicators and country comparisons